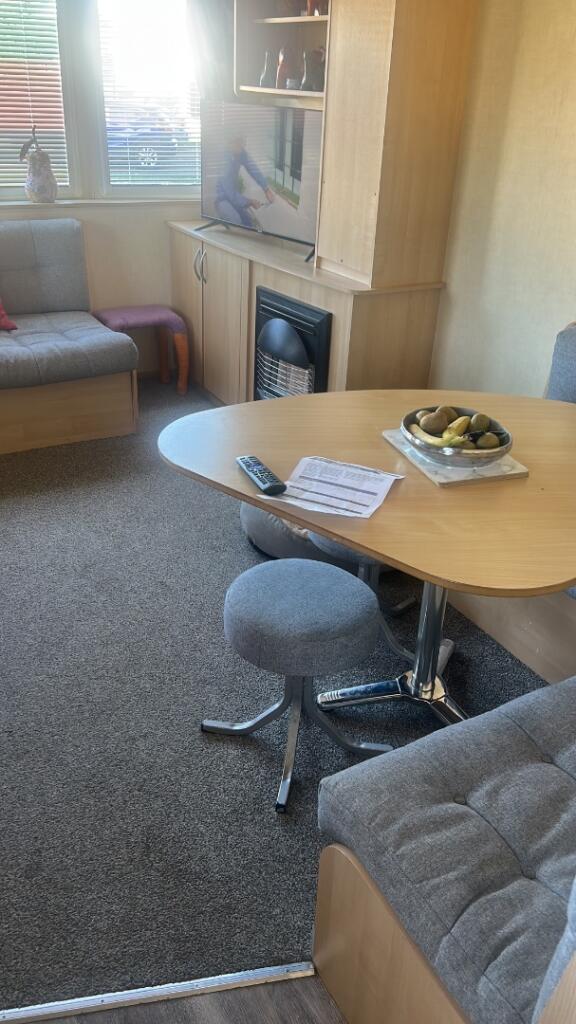
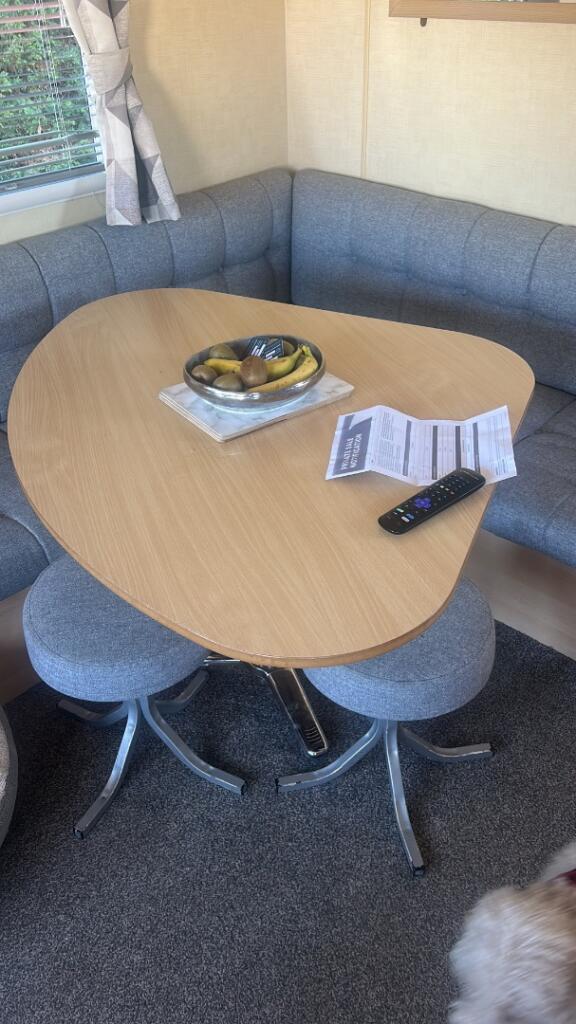
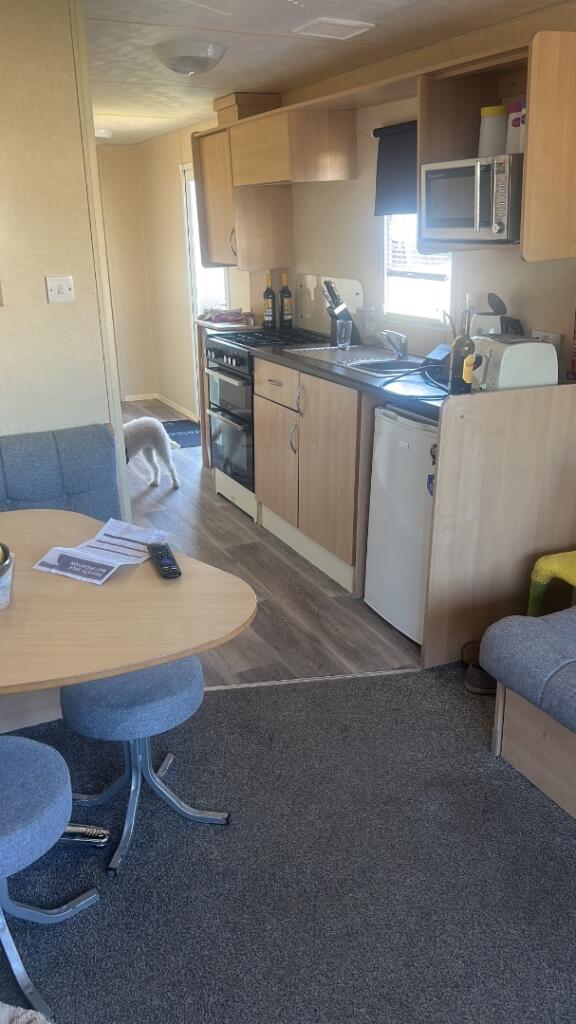
1 / 11
| Step | Value | Effect | × multiplier |
|---|---|---|---|
| London-wide baseline | model average | £8,111/sqm | |
| Location (nearby obs. £5,650/sqm · 11 props · 234.39 km) | this area | -65% | ×0.35 |
| Size | 432 sqft (40 sqm) | ×1.26 | |
| Bathrooms | 1 | ×0.94 | |
| Bedrooms | 3 | ×1.03 | |
| Property type | Detached | ×1.02 | |
| Tube/rail distance | 160.74 mi | ×0.99 | |
| Garden | unknown | ×0.99 | |
| = Predicted £/sqm |
£3,484/sqm
range £2,901–£3,765
|
||
Each multiplier is a SHAP value from the CatBoost model. The chain is exact: baseline × location × property factors = predicted £/sqm. Nearby observed rate shown as context only. Range = P10–P90 quantile models.
Linear regression on log(price). Each row shows how much that factor adds or subtracts, compounding from left to right until the final estimate.
| Factor | Detail | Effect | Running estimate |
|---|---|---|---|
| Base (intercept) | £14,372 | ||
| Location (outcode) | SW1A | +304.6% | £58,151 |
| Size | 432 sqft | +1876.2% | £1,149,173 |
| Bedrooms/bathrooms | 3bd / 1ba | +48.5% | £1,706,679 |
| Transport | 160.74 mi to Green Park Station | -5.7% | £1,608,618 |
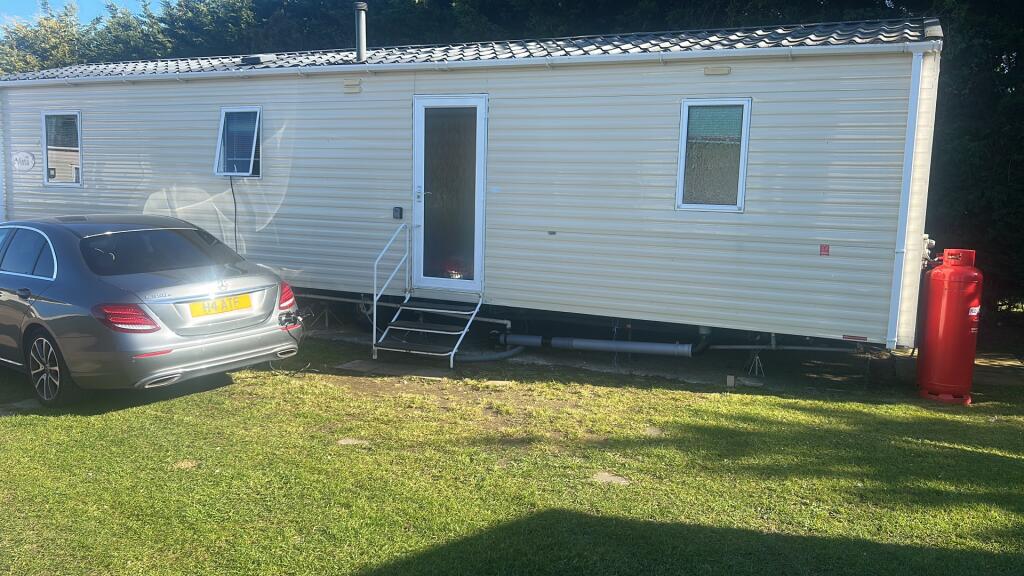
| Property type | Park Home | -42.5% | £924,645 |
| Garden | unknown | -6.0% | £869,413 |
| Floor | unknown floor | — | £869,413 |
| Date | Price |
|---|---|
| 2026-07-24 | £13,000 |
| 2026-07-29 | £13,000 |
| 2026-08-01 | £13,000 |